by SeanPavonePhoto via AdobeStock
Climate change impacts
In 2012, Hurricane Sandy struck New York City and New Jersey, resulting in 73 deaths, destruction of thousands of homes, and property damage estimated at $68 billion.
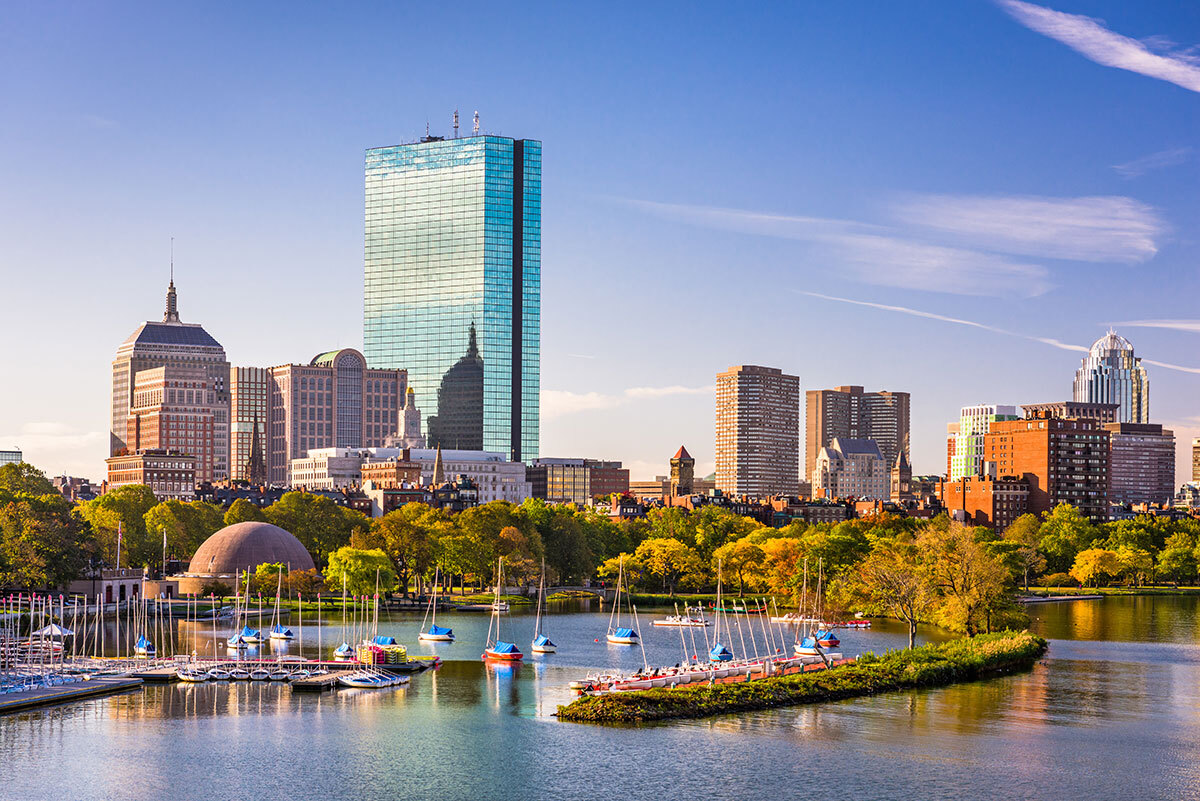
200 miles north of New York City in Boston, an increase in coastal floods, torrential rainfall, and heat waves are projected as the City takes measures to prepare for potential extreme weather events.
Adaptation activity
Boston has worked with a broad coalition of stakeholders to launch the climate-change adaptation initiative “Climate Ready Boston,” which was finalized and published in 2016. The final report is organized into four sections: (1) current climate projections; (2) vulnerability assessment; (3) area selection; and (4) climate resilience initiatives. In the first section, the projections of extreme temperatures, sea level rise, extreme precipitation, and storms were developed. Using these findings, a comprehensive assessment of various current and future climate change hazards was created, with regard to effects on Boston’s citizens, buildings, infrastructure, and economy: ① hot weather; ② stormwater flooding; and ③ coastal and river floods. Eight priority areas were identified from the vulnerability assessment to indicate Boston’s risks, and the climate resilience approach was applied in detail to demonstrate what measures may be taken. Climate resilience is divided into five layers: (i) obtaining up-to-date climate projections; (ii) preparing and connecting communities; (iii) coastal protection; (iv) robust infrastructure; and (v) adaptive buildings (fig.). These layers are further divided into 11 strategies and 39 initiatives.
Outputs / Expected benefits
In preparing its final report, Boston gathered expertise from a number of universities and other institutions, as well as engaging the participation of different stakeholders, from vulnerable populations to representatives of major commercial enterprises. The latest information on the progress of the Climate Ready Boston initiative and related news can be viewed on the City of Boston website (see Note).

Fig. Layers and Strategies for Climate Resilience
(Purple: Coastal Line, Orange: Community, Blue: Infrastructure, Blue: Building)
(Source: City of Boston "Climate Ready Boston Final Report”)
Related Information
KEYWORDS
- # Case Study
- # Coastal Areas
- # Infrastructure
- # Life of Citizenry and Urban Life
- # Natural Disasters
- # Water Environment/Water Resources
- # Adaptation Action/implementation
- # Adaptation Planning/Policy
- # Climate Projection
- # Disaster Prevention/Disaster Mitigation
- # Impact Assessment/Risk Assessment
- # North America
- # United States
- # 2021


